Jan 27, 2014

Create Header Image for free


Here are some cool websites and online tools offering you free header images. You can use them for creating banner, header for your website, presentations, blogs ...


1. Free Web Headers.com
             just  browse through different categories and download ready to use image for your header.

2. Banner Fotor
             create your own design, a quick editor for good headers in couple of minutes

3. Freepik
             a good gallery not only for banners, headers....

4. Bannerfans
            again a good quick editor to design banner of your choice.

5. Free webpage headers
            one more gallery to choose your ready to use header image....

Oct 13, 2013

Reports Vs Dashboards

Q: What is difference between a Report and Dashboard ?

Wrong Ans: This is the question that i have asked to many people and most of them answers : Dashboards are interactive and reports are not. (Which is not correct)

Those who thought of same answers, just tell me can't i have a report with any of BI tools which can have some interactivity..... yes wen can have many interactive options in a report.

Then, whats the difference...

"to take a decision you need to process the information from a report, while Dashboard  provides you processed information which can be directly consumed and you can directly take decision based on it."

for example - your car dashboard. When you look at your car dashboard it shows you speed. Your car speed is the information which you can directly consume and can take decision like slow down or accelerate more. Suppose, instead of speed in Miles/hr or KM/hr , if dashboard would show you the rpm of your wheels and the distance covered by wheels in one revolution then you might have to calculate the speed using the information available and then come to decision.

This examples helps you what to show in your Dashboard and what not. Only that information should be shown in a dashboard which can be consumed directly with out any processing and is really required.

Intorduction to Datawarehousing

These slides may be of use for new beginners those who want to understand BO in terms of Datawarehouse.


Intoduction to Datawrehousing

Sep 27, 2013

How to Fix non continuous/ step lines in line Graph in Microstrategy


How to Fix non continuous/ step lines in line Graph:


Using desktop edit graph properties and uncheck step line option from Series properties.


Dec 21, 2012

Comparing BO Webi vs SSRS

Webi from BO and SSRS from Microsoft are always in competition with each other. Both of them are good products catering to similar business needs in different styles. I have been using Webi and SSRS for my projects and i always think first which one should i use before starting a new one. Here i would be doing this comparison that may help others to opt between the two.


  1. Formatting - SSRS provides you good flexibility in formatting your reports but Webi does it better. In webi you can align your components charts with better look and feel than SSRS. Also formatting is easier in webi as its all gui based while  in SSRS its all visual studio like environment so bit of complexity.  Hence i would give webi 5 and SSRS 4
  2. Rendering - SSRS rendering is really bad when it comes to PDF, they don't give bookmarks for tabs in report. Also quality of formatting in Webi generated PDF is better. Here SSRS looses and webi wins. Hence Webi gets 5  and SSRS 3
  3. Ease of use - Again webi takes advantage here. SSRS is too complex for a new beginner. Like tablix concept, conditional formatting and all, everything is expression based which makes it too much to code.  i will give webi 4 and SSRS 3
  4. Flexibility - Here SSRS is champ. you have got every thing to be modified as per your requirement. You can use custom functions, custom codes, colors, borders, text, and any property can be made dynamic using expressions. While in Webi only limited things are there to be modified. so Webi gets 2 and SSRS gets 5
  5. Error reporting - When you schedule webi and if it gets failed, Webi gives you error details specifically. While, in SSRS error details is mostly generic. Webi gets 5 and SSRS gets 3
  6. Managing History Instances - SSRS have tried to do a lot but less when comparing to Webi. Webi is better. Webi 5 and SSRS 4
  7. Error prone - While working with webi, there have been many instances where you just cant explain the erroneous behavior of Webi reports. Some times your report tabs goes away, some times you formatting your webi formatting is corrupted. And most of all java creates a lot of problem while working with webi. In case of SSRS its completely free of such errors. So SSRS 5 and webi 2
Finally total scores : Webi  - 28 and SSRS -  27

Over all if you are looking for better formatting and easy to use gui Webi is for you. But if you want better flexibility and less rework then SSRS can be the choice.

Please Note: these are my views based on my experience. Some people may have different opinions.


Dec 20, 2012

Webservices - Xcelsius best Connection type

After using live office, QaaWS and other connection types, we always struggle with our xcelsius projects for optimization in loading and execution time. Live office is most delayed and cumbersome approach. Though QaaWS can help much in optimizing dashboard performance but still, its no where in comparison with asp.net web services (because BO server layer is bypassed). After trying all the connection types, finally i have decided which one to use for my dashboards.

Following are main advantages of asp.net web services which forces me to use them :


  1. Fastest approach in comparison to any other connection type.
  2. No universe dependency. Hence, better for people not having direct access to universe
  3. All the query can be managed in asp code. Hence, aggregations and data formatting can be managed in better way at asp level.
  4. No struggling with excel issues as comparing with Liveoffice.
  5. Dashboards can be shared outside BO environment (infoview) as the login to datasource can be managed in asp.net webservice. So it makes very easy to share Xcelsius dashboards over intranet in form of embedded objects in webpages.
The only obstacle in using asp.net web services might be that you may not be a coder of asp.net. But that's not a big deal. You can google around to make webservices. Well I'll be posting an article for creating asp.net webservices that can be consumed in xcelsius soon.....

Webi error : Blue Yellow formatted table with no data

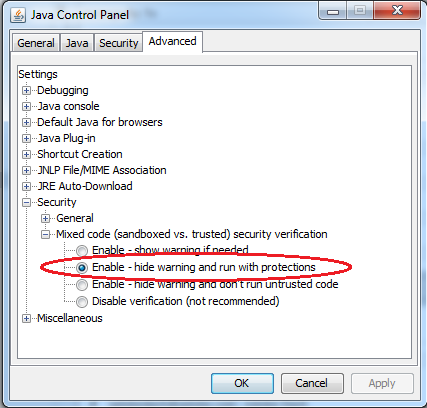
Sometimes it happens that when you create a new webi and fetch results in a table, Webi generates a Blue and yellow color table with no results visible. This is a problem because of java.Your system automatically upgrades java and changes some settings.


To overcome this issue , following steps can be used :

1. Go to control Panel and open java settings
2. In Java control panel, got to advanced tab and expand Security option.


3. Then expand Mixed code option and click on ' Enable  - hide warning and run with protections '


4. Click OK and Close all browsers and make sure you logout from infoview. Then login to infoview and start creating webi, every thing will be fine now.